Facebook Ads Funnel Leak Calculator
Find exactly where your ad funnel is losing money. Enter your numbers at each stage — we'll visualize the drop-offs, calculate costs per step, and pinpoint your biggest leak with a fix.
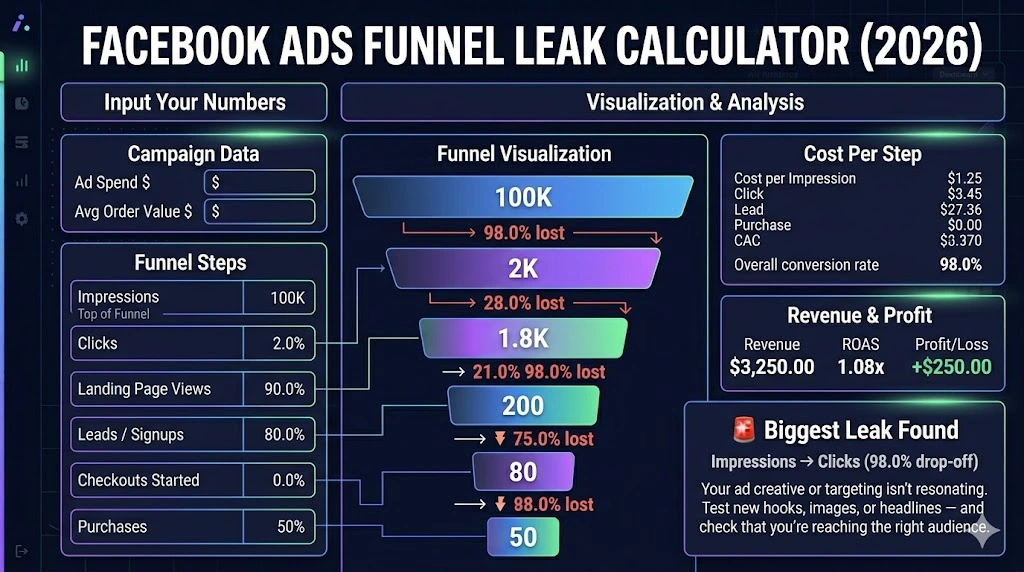
Showing example data — edit any field to see your own funnel
Campaign Data
Funnel Steps
top of funnel
2.0%
−98.0% drop
90.0%
−10.0% drop
11.1%
−88.9% drop
40.0%
−60.0% drop
62.5%
−37.5% drop
Funnel Visualization
Biggest Leak Found
Impressions → Clicks
98.0% of users drop off at this step
Your ad creative or targeting isn't resonating. Test new hooks, images, or headlines — and check that you're reaching the right audience.
Cost Per Step
Revenue & Profit
Revenue
$3,250.00
ROAS
1.08x
Profit / Loss
+$250.00
What Is a Funnel Leak?
A funnel leak is any step in your advertising funnel where an abnormally high percentage of users drop off instead of progressing to the next step. Every funnel has natural drop-off — not every impression becomes a click, not every click becomes a purchase. But when one step loses significantly more users than expected, that's a leak, and it's costing you money.
For example, if your CTR (Impressions → Clicks) is 2% and your landing page conversion rate (Landing Page Views → Leads) is only 1%, your landing page is the leak. You're paying for traffic that your page isn't converting. Fixing that single step could double your leads without increasing ad spend.
This calculator analyzes your entire funnel from impressions to purchases, calculates the conversion rate and cost at each step, and automatically identifies the step with the highest drop-off percentage — your biggest leak. It then provides a targeted recommendation for what to fix.
How to Use This Calculator
Pull your numbers from Meta Ads Manager for a specific campaign or ad set. You'll need impressions, clicks, and your downstream conversion events (landing page views, leads, checkouts, purchases). Enter your total ad spend and average order value to see profitability metrics alongside the funnel analysis.
- Enter your ad spend and average order value at the top.
- Fill in each funnel step from impressions down to purchases. Leave any step at 0 if you don't track it.
- Read the funnel visualization — bars shrink proportionally to show where volume drops.
- Check the “Biggest Leak” card — this is the step you should fix first.
- Review cost per step to understand how ad spend compounds through the funnel.
How to Fix Funnel Leaks
Each step in the funnel has different optimization levers. Here's a quick guide:
Low CTR (Impressions → Clicks)
Your creative isn't stopping the scroll. Test new hooks in the first 3 seconds of video, try UGC-style creative, test bold headlines, or narrow your audience to people more likely to care about your offer. Benchmark: >1.5% CTR for cold traffic.
Low Landing Page Rate (Clicks → LPV)
Users click but bounce before the page loads. Check page speed (aim for <3s), ensure mobile responsiveness, and make sure the landing page matches the ad's promise. Use PageSpeed Insights to diagnose.
Low Signup Rate (LPV → Leads)
The page loads but doesn't convert. Simplify your above-the-fold section, reduce form fields, add social proof (reviews, logos, testimonials), and make the CTA button stand out. Test different offers (discount vs. free shipping vs. lead magnet).
Low Checkout Rate (Leads → Checkout)
Interest is there but commitment drops. Check your pricing page for clarity, offer payment options (BNPL, PayPal), and improve your email/SMS follow-up sequence for leads who don't immediately convert.
High Cart Abandonment (Checkout → Purchase)
Users start checkout but don't finish. Look for surprise costs (shipping, taxes added late), add trust badges and security indicators, simplify checkout to fewer steps, offer guest checkout, and implement abandoned cart emails/SMS within 1 hour.
Frequently Asked Questions
What is a good overall conversion rate for a Facebook Ads funnel?▼
For ecommerce, a typical full-funnel conversion rate (impressions to purchases) is 0.01%–0.1%. For individual steps: CTR above 1.5%, landing page conversion above 3%, and checkout completion above 60% are solid benchmarks. The most important metric isn't any single rate — it's finding which step is significantly worse than these benchmarks.
How do I find these numbers in Meta Ads Manager?▼
Go to Meta Ads Manager → Columns → Customize Columns. Add: Impressions, Link Clicks, Landing Page Views, Leads, Initiate Checkout, and Purchases. Set the date range to match the period you want to analyze. Export the data and enter the totals here.
What if I don't track all funnel steps?▼
Enter 0 for any step you don't track. The calculator will still analyze the steps you do have. At minimum, you need impressions, clicks, and purchases to get useful insights. For the most actionable analysis, track all 6 steps using Meta's standard events.
Should I analyze at the campaign, ad set, or ad level?▼
Start at the campaign level for a high-level view, then drill into ad sets and ads. Different audiences (ad sets) often have different leak points. One ad set might have a CTR problem while another has a landing page problem. Analyzing each separately reveals where to focus.
How often should I check for funnel leaks?▼
Weekly for active campaigns. Funnel performance shifts as audiences fatigue, seasonality changes, and competitors adjust. A step that was performing well last month can become your biggest leak this month. Set a weekly review cadence tied to your reporting cycle.
What's the difference between this and a regular ROAS calculator?▼
A ROAS calculator tells you if your ads are profitable overall. This funnel leak calculator tells you WHY they are or aren't — and exactly where to fix them. It breaks down the entire user journey from impression to purchase and pinpoints the weakest link. Use both together: this calculator to diagnose, ROAS calculator to measure the impact of your fixes.
Frequently Asked Questions
- What is a good overall conversion rate for a Facebook Ads funnel?
- For ecommerce, a typical full-funnel conversion rate (impressions to purchases) is 0.01%–0.1%. For individual steps: CTR above 1.5%, landing page conversion above 3%, and checkout completion above 60% are solid benchmarks.
- How do I find these numbers in Meta Ads Manager?
- Go to Meta Ads Manager → Columns → Customize Columns. Add: Impressions, Link Clicks, Landing Page Views, Leads, Initiate Checkout, and Purchases. Set the date range to match the period you want to analyze.
- What if I don't track all funnel steps?
- Enter 0 for any step you don't track. The calculator will still analyze the steps you do have. At minimum, you need impressions, clicks, and purchases to get useful insights.
- What's the difference between this and a regular ROAS calculator?
- A ROAS calculator tells you if your ads are profitable overall. This funnel leak calculator tells you WHY — and exactly where to fix them. It breaks down the entire journey from impression to purchase and pinpoints the weakest link.
- How often should I check for funnel leaks?
- Weekly for active campaigns. Funnel performance shifts as audiences fatigue, seasonality changes, and competitors adjust. A step that was performing well last month can become your biggest leak this month.
- Should I analyze at the campaign, ad set, or ad level?
- Start at the campaign level for a high-level view, then drill into ad sets and ads. Different audiences often have different leak points — one ad set might have a CTR problem while another has a landing page problem.
Powered by HumanCalculations — free online calculators